Case Study - A weight tracker that shows the trend, not the noise
An iOS app whose twelve-algorithm statistical engine (EWMA smoothing, Hampel filtering, Theil-Sen slopes) separates real body change from daily fluctuation, entirely on device.
- Client
- Weightics
- Year
- Service
- iOS Development, Data Science & ML
Overview
The trend under the number
- EWMA smoothing
- Hampel filter
- Theil-Sen slope
- Seasonality removal
- Confidence bands
- On-device only
The engine
From raw entry to real trend
Clean the signal
Hampel winsorization and 3σ/MAD checks catch the entries that are measurement error rather than body change: a scale on carpet, a heavy meal, a weigh-in at the wrong hour.
Smooth the trend
EWMA with an adaptive half-life, plus a Theil-Sen median slope that survives the outliers a least-squares fit would chase.
Remove the week
Weekend effects are real and predictable. Detecting weekly seasonality and subtracting it stops Monday from reading as failure.
Earn confidence
A DataPhase progression rates how far the trend can be trusted yet, so the dashboard says “Building your trend, 31%” instead of faking certainty from four entries.
Project forward
Seven-day projections ship with a confidence band, so the forecast shows its own uncertainty rather than a single confident line.
Product
The app, screen by screen
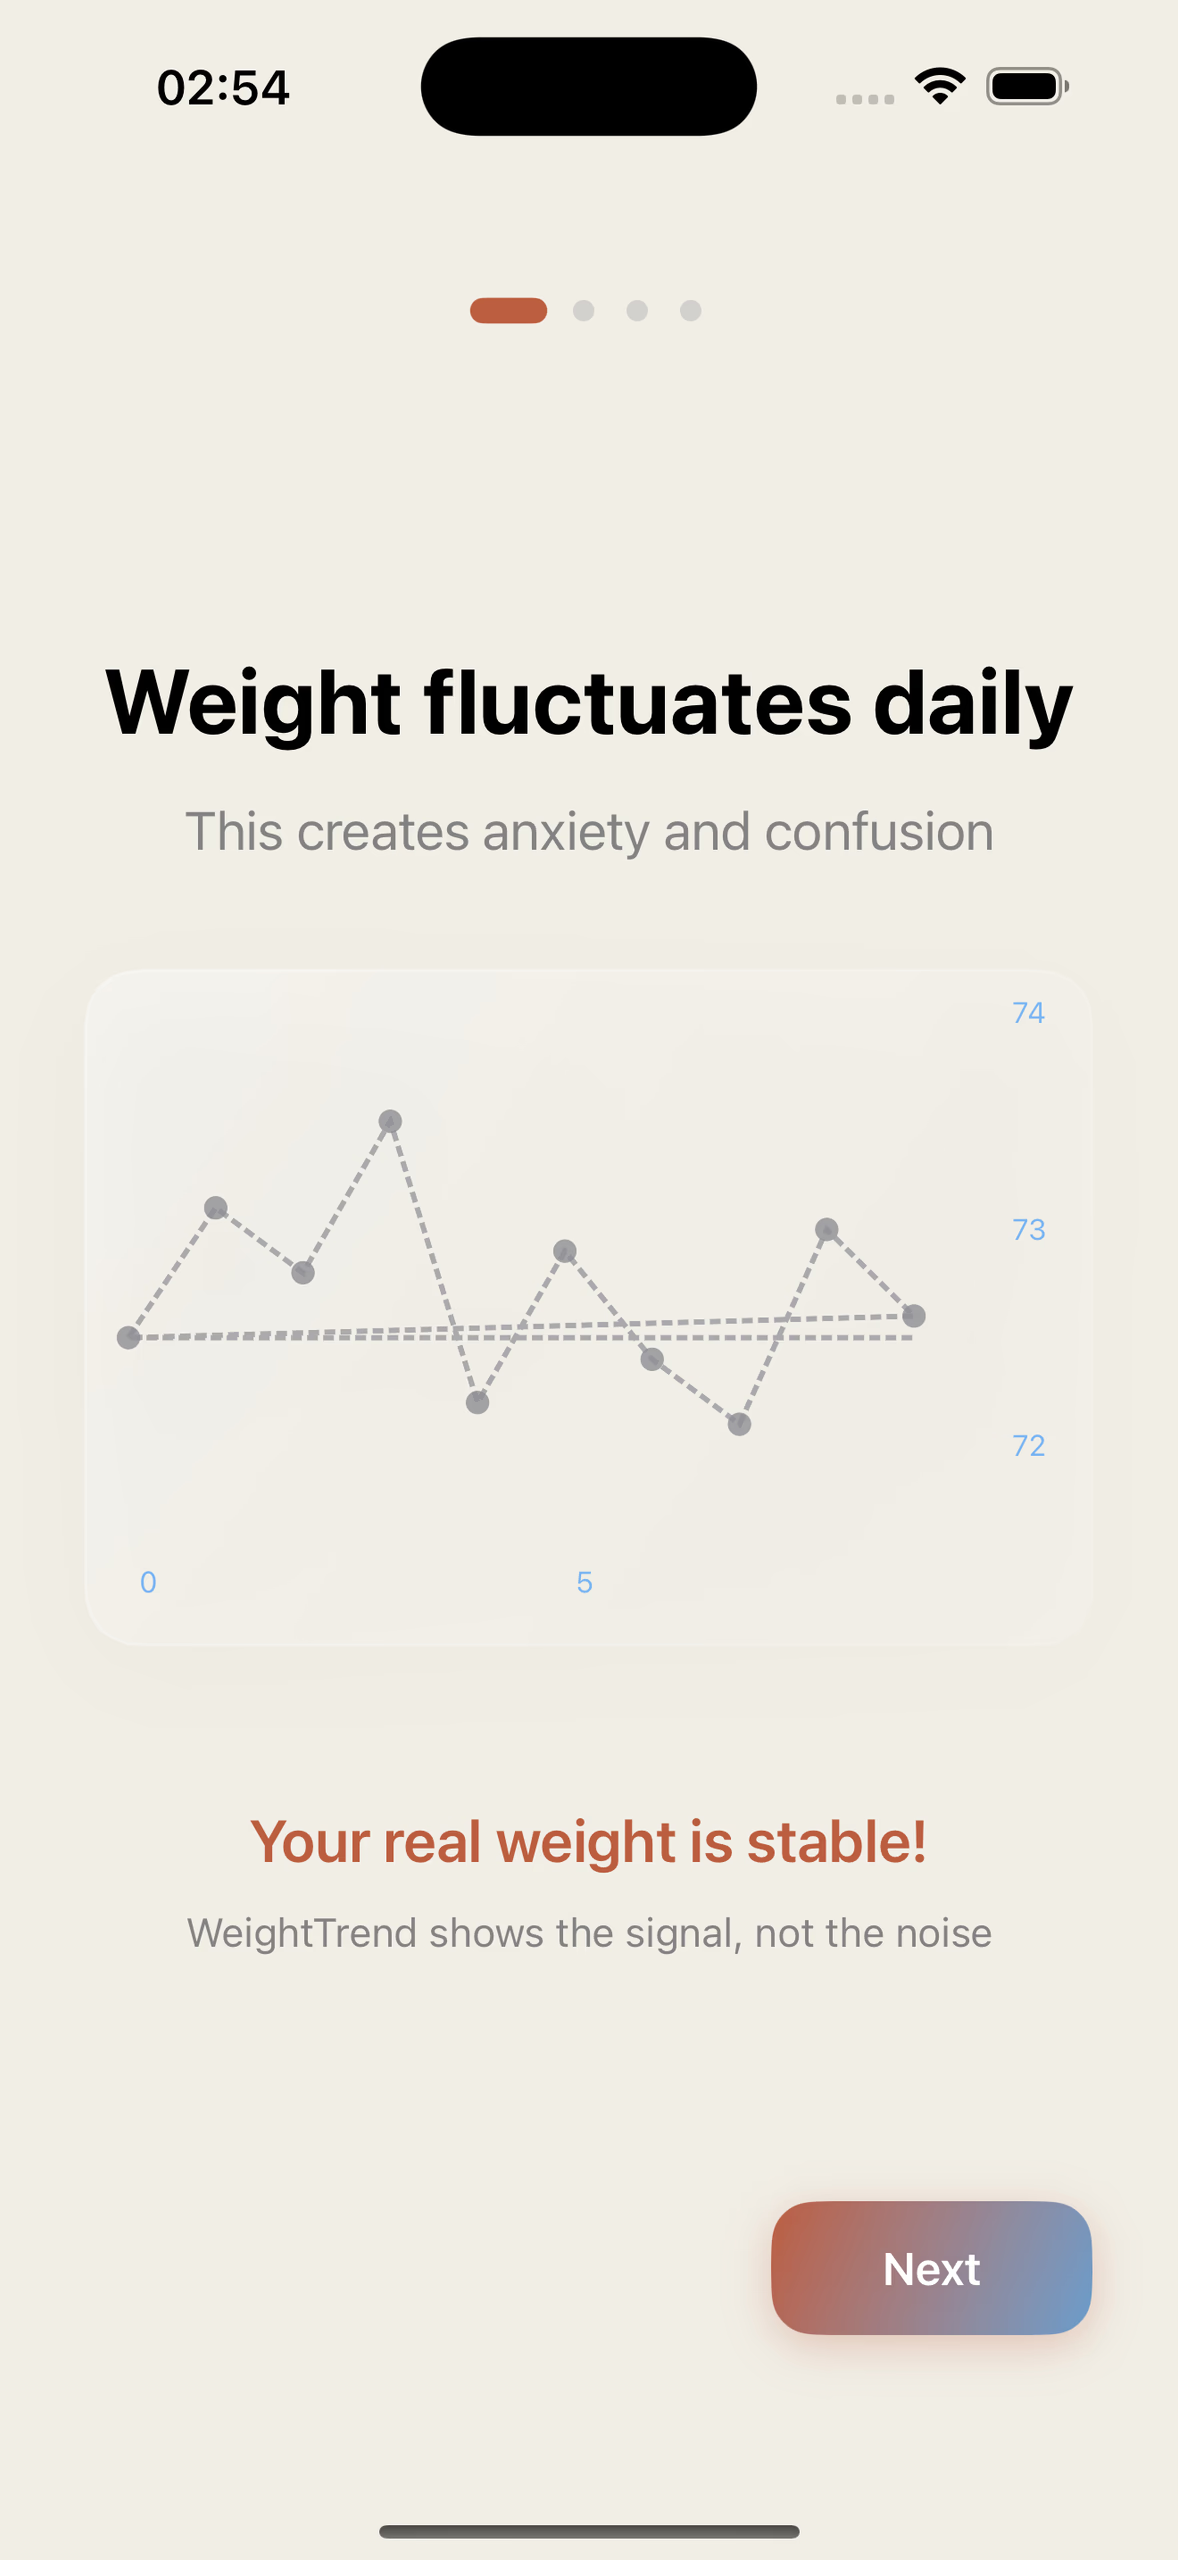
Onboarding · the thesis
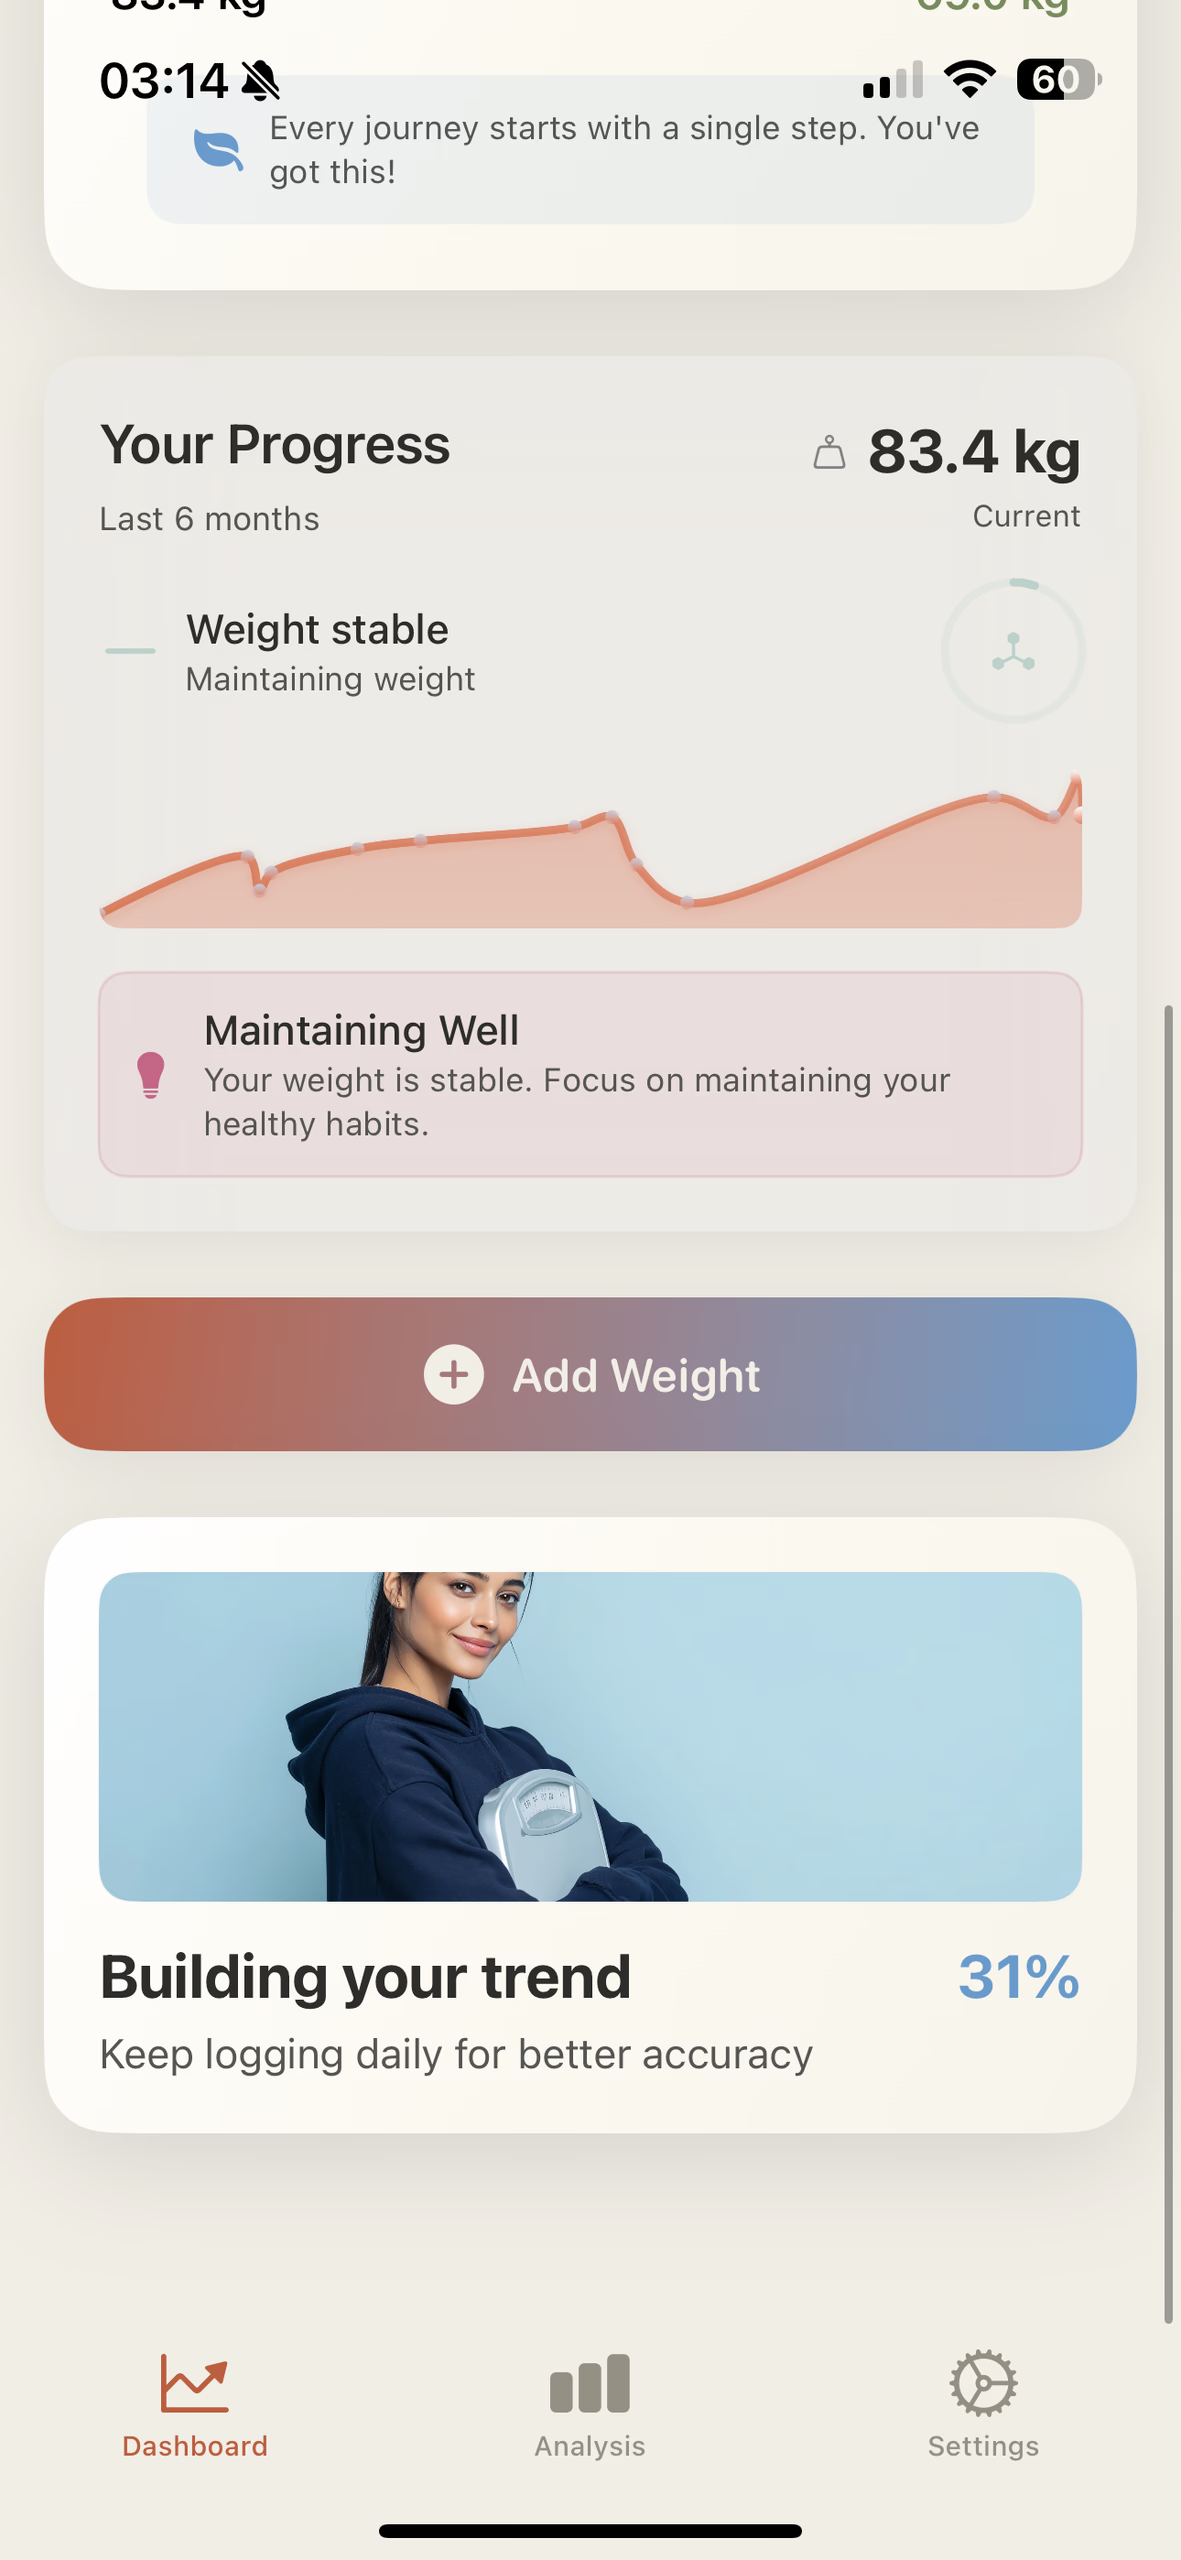
Dashboard
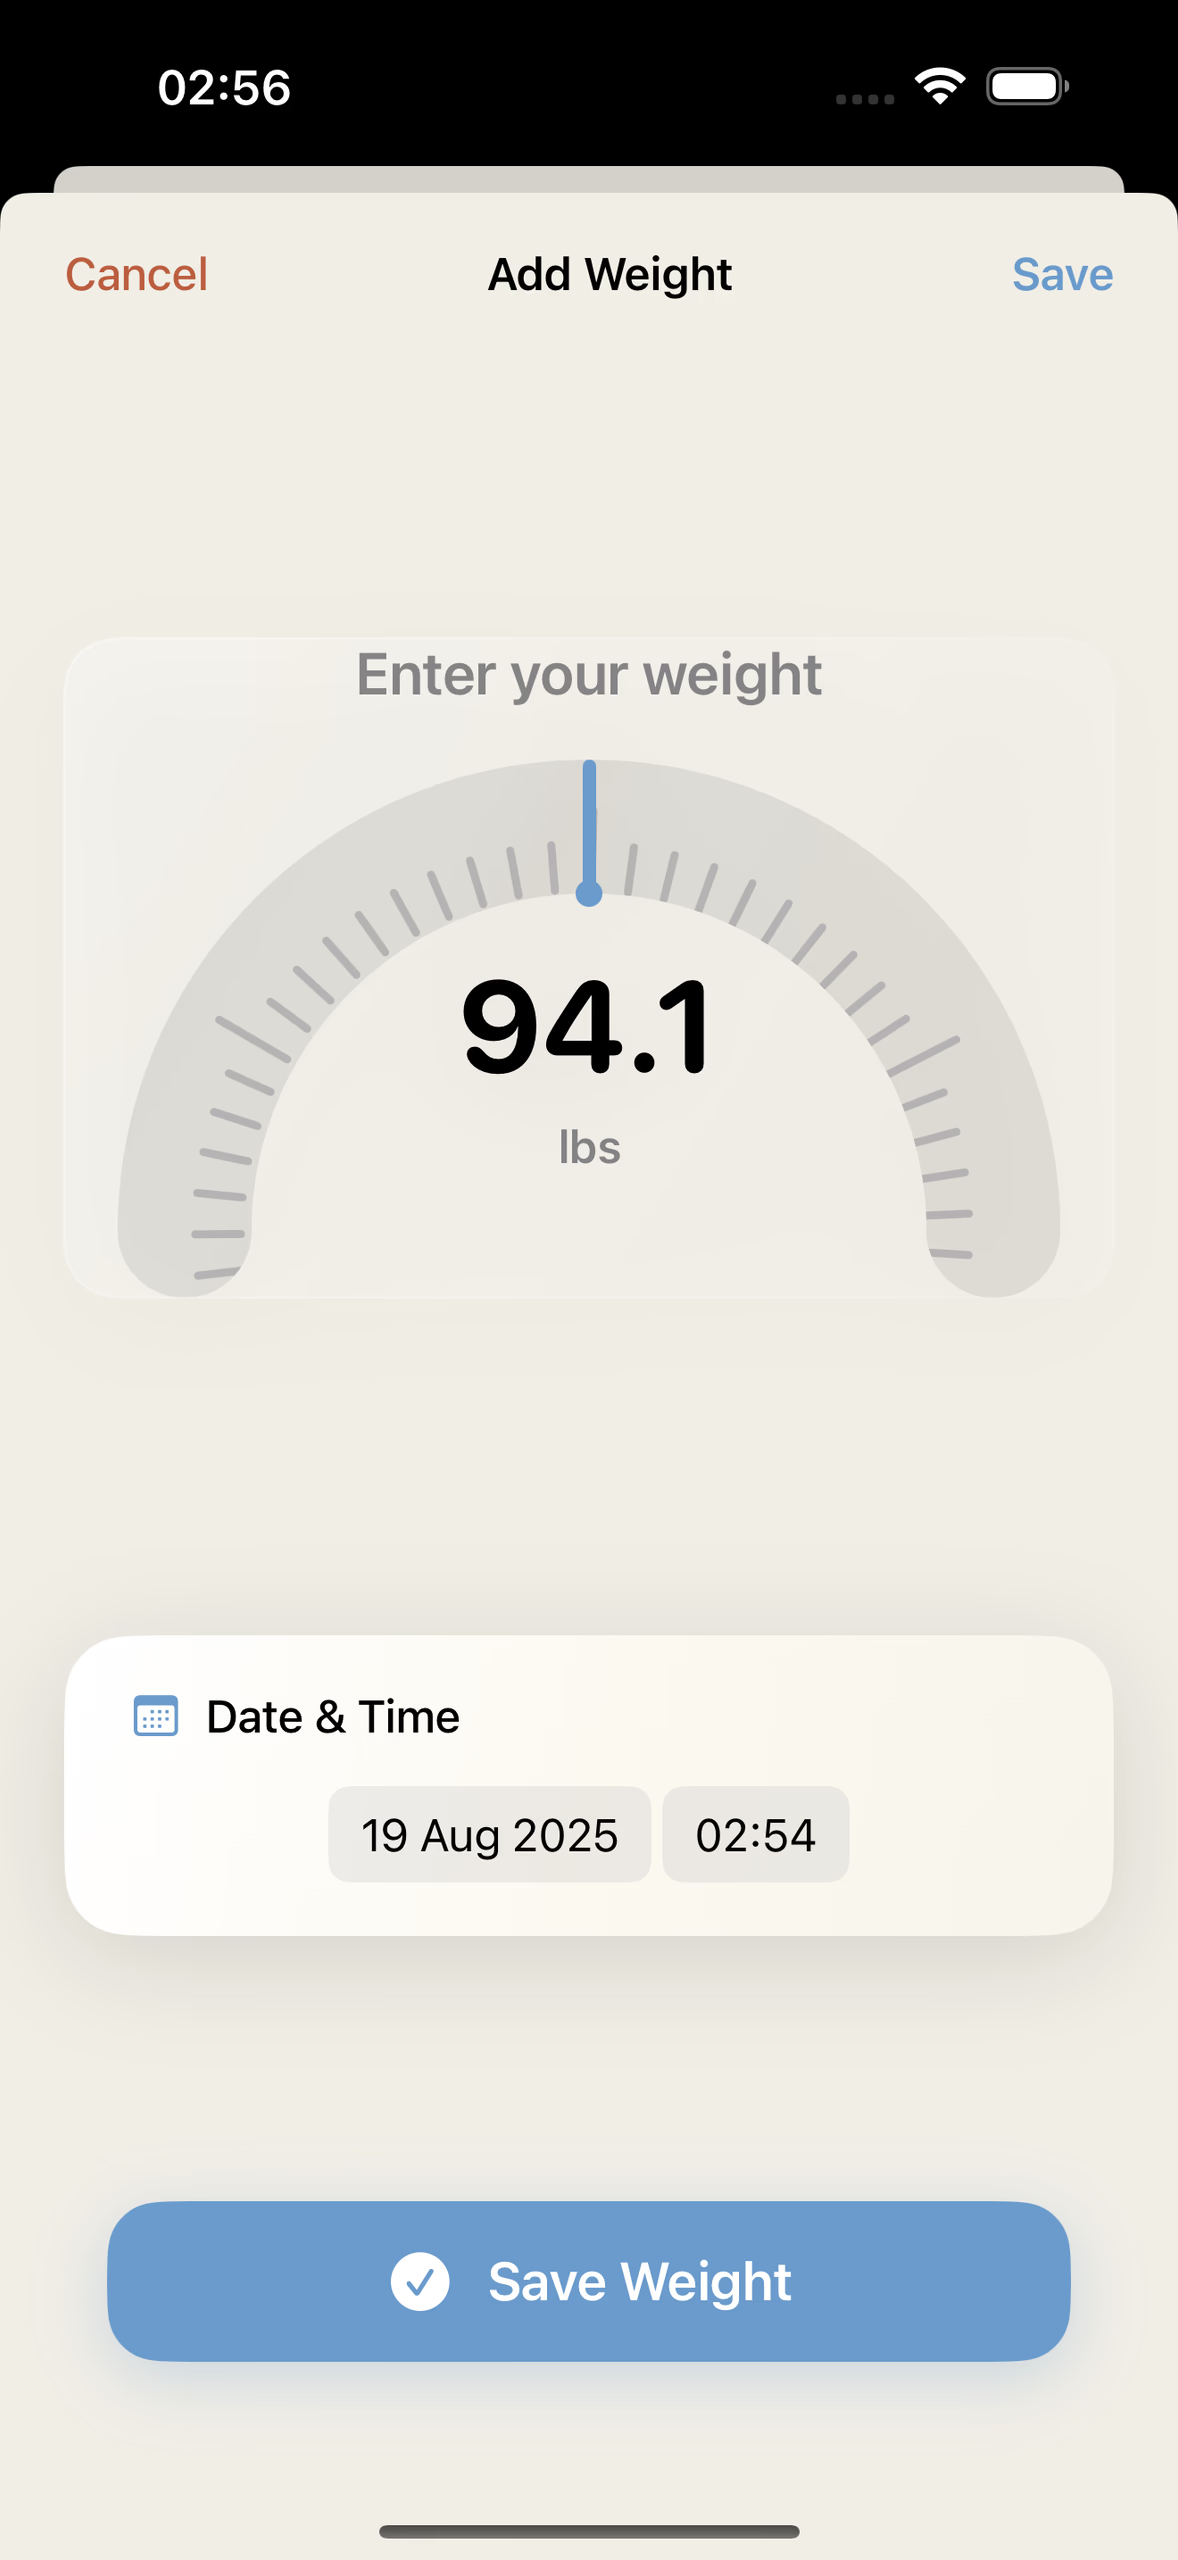
Entry · dial
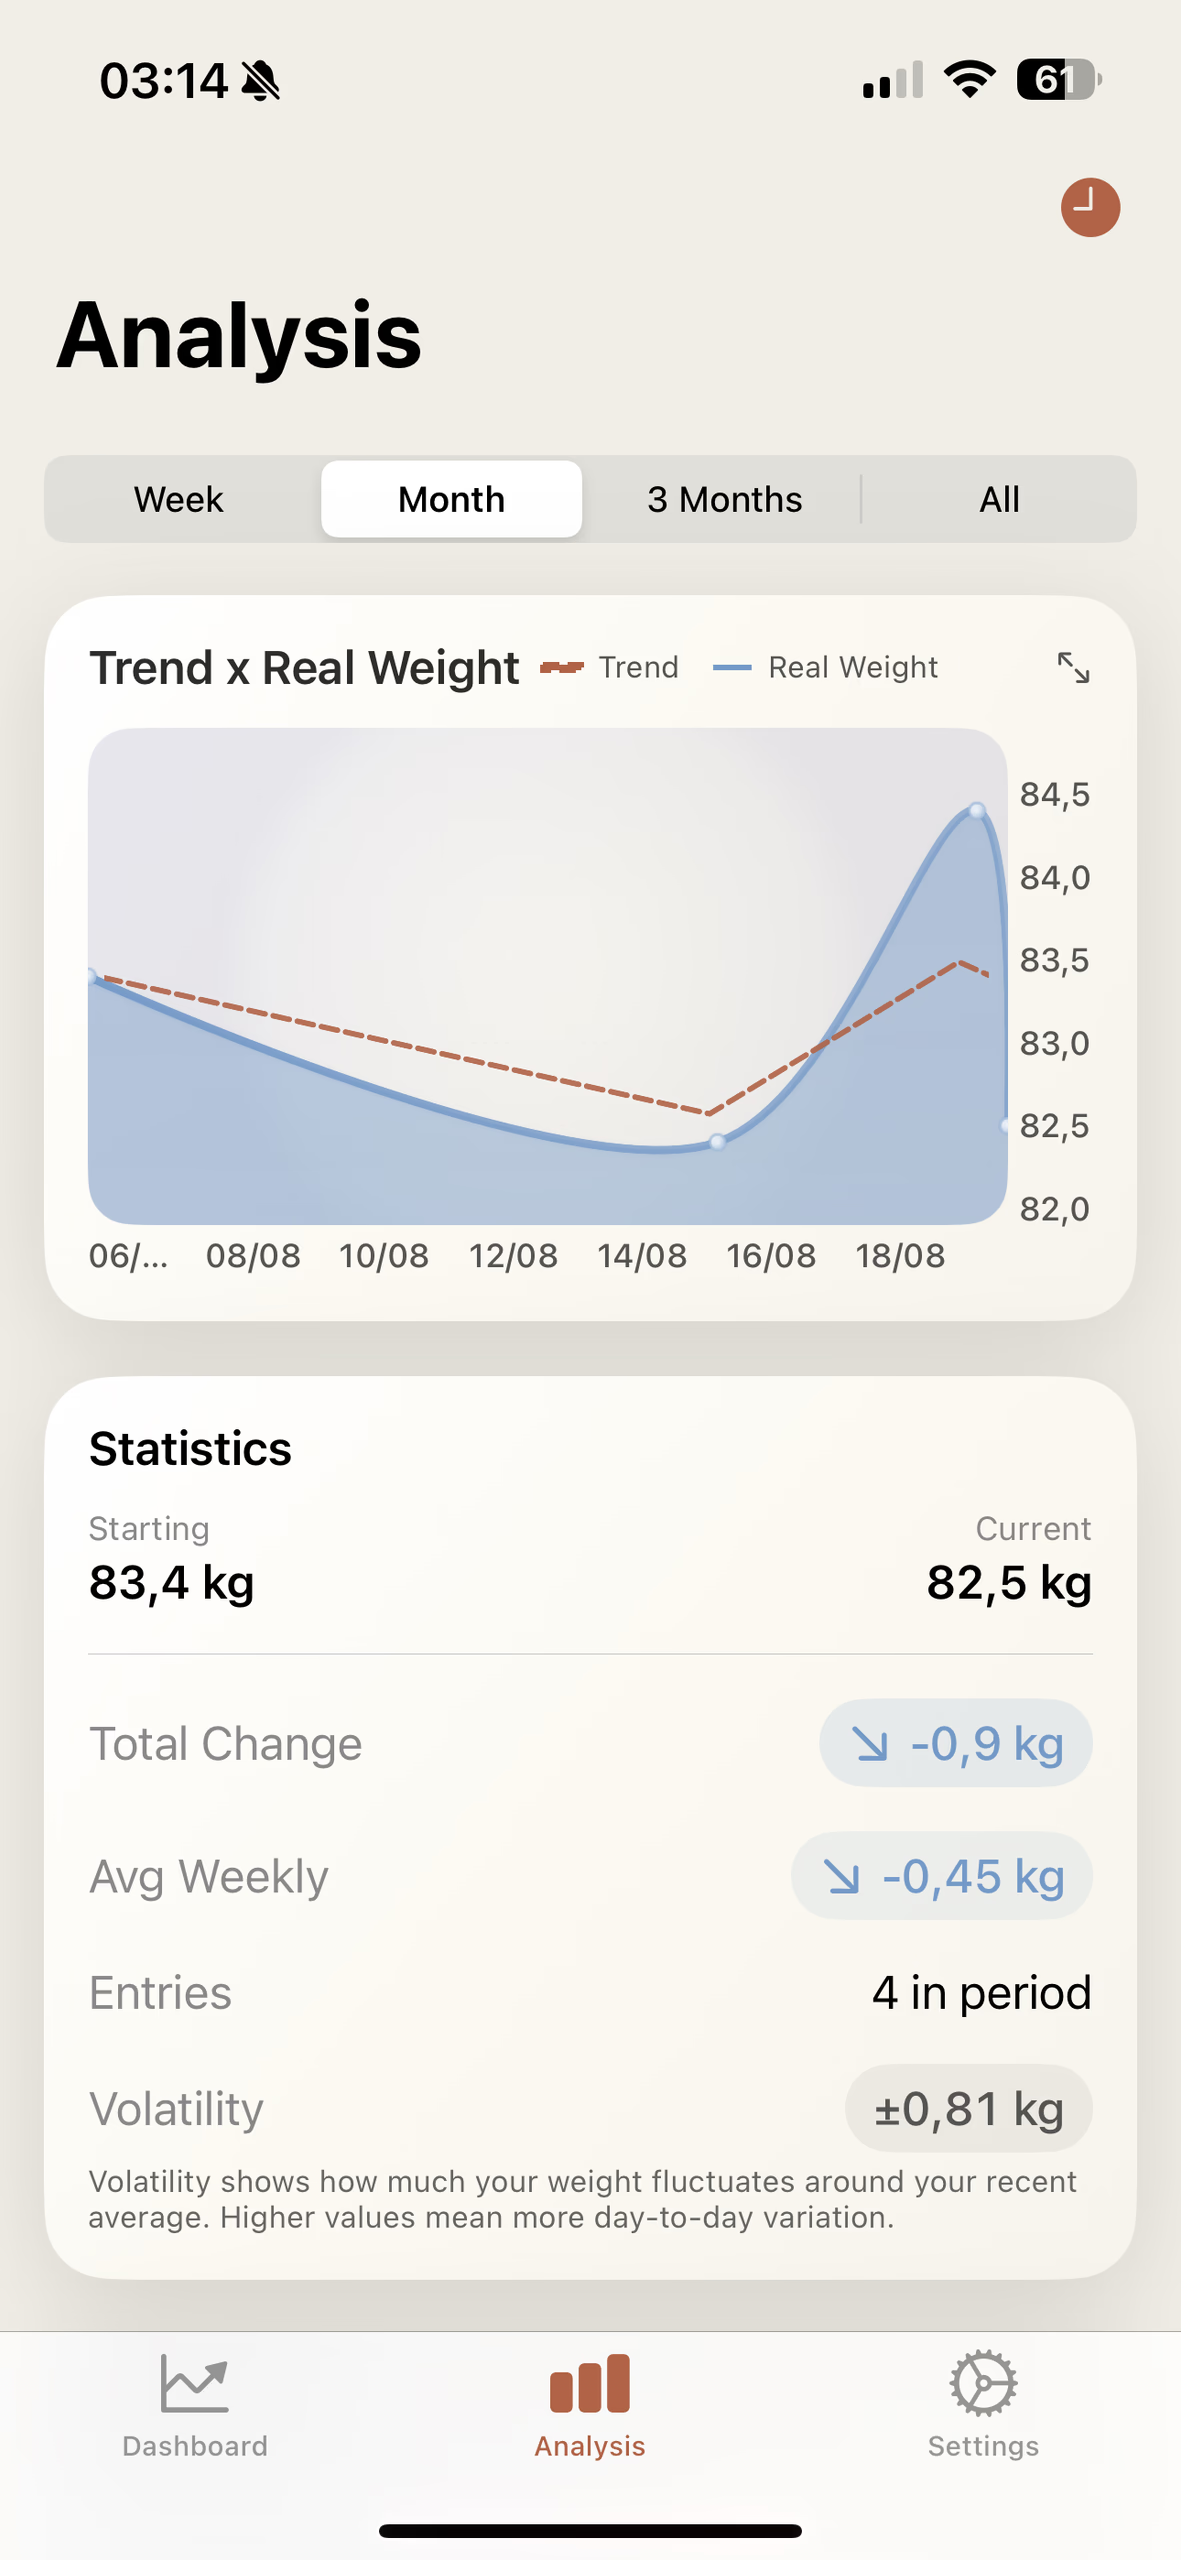
Trend × real weight
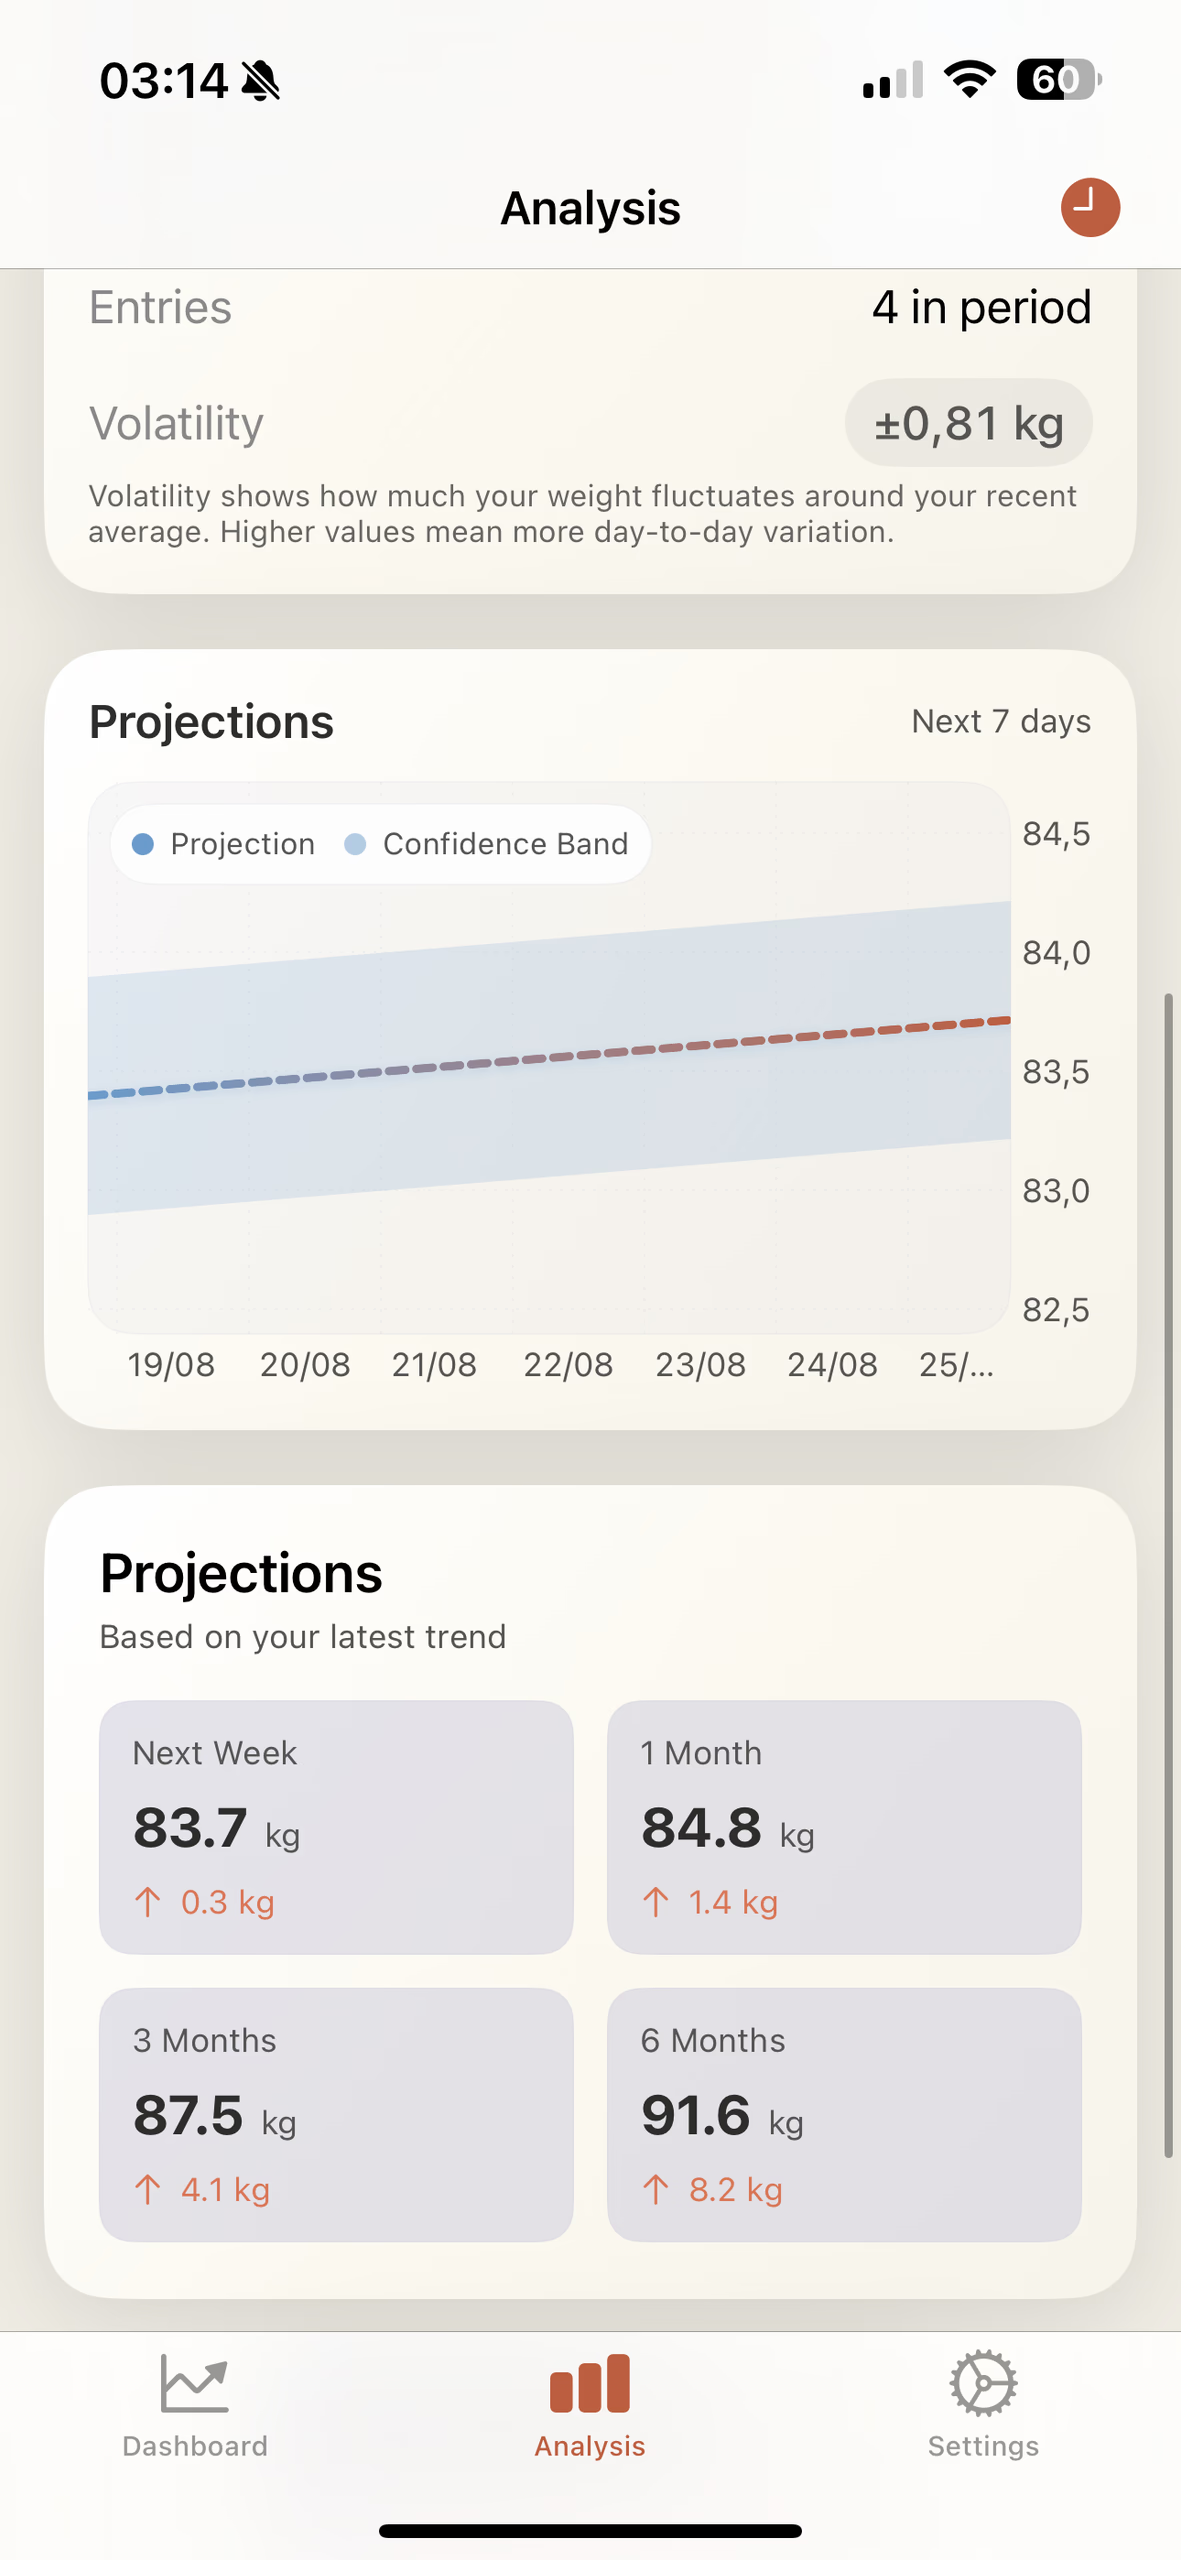
Projections · confidence band
Stack & proof
The maths never leaves the phone
Algorithms in the ensemble, EWMA and Theil-Sen among them
Forecast horizon, shipped with its confidence band
Aggregation windows: 7, 14, 21 and 30 days
Bytes of weight data leaving the phone
Technologies
- Swift
- SwiftUI
- SwiftData
- Swift Charts
- HealthKit
- iCloud sync
- Background Tasks
- RevenueCat
Swift Charts renders the trend against real weight; SwiftData persists entries and syncs through iCloud; HealthKit reads and writes body mass in the background. The premium tier (auto-sync, projections, advanced analytics) is metered through RevenueCat.